W3cubDocs
/Matplotlib 1.5patches
matplotlib.patches
-
class matplotlib.patches.Arc(xy, width, height, angle=0.0, theta1=0.0, theta2=360.0, **kwargs) -
Bases:
matplotlib.patches.EllipseAn elliptical arc. Because it performs various optimizations, it can not be filled.
The arc must be used in an
Axesinstance—it can not be added directly to aFigure—because it is optimized to only render the segments that are inside the axes bounding box with high resolution.The following args are supported:
- xy
- center of ellipse
- width
- length of horizontal axis
- height
- length of vertical axis
- angle
- rotation in degrees (anti-clockwise)
- theta1
- starting angle of the arc in degrees
- theta2
- ending angle of the arc in degrees
If theta1 and theta2 are not provided, the arc will form a complete ellipse.
Valid kwargs are:
Property Description agg_filterunknown alphafloat or None animated[True | False] antialiasedor aa[True | False] or None for default axesan Axesinstancecapstyle[‘butt’ | ‘round’ | ‘projecting’] clip_boxa matplotlib.transforms.Bboxinstanceclip_on[True | False] clip_path[ ( Path,Transform) |Patch| None ]colormatplotlib color spec containsa callable function edgecoloror ecmpl color spec, or None for default, or ‘none’ for no color facecoloror fcmpl color spec, or None for default, or ‘none’ for no color figurea matplotlib.figure.Figureinstancefill[True | False] gidan id string hatch[‘/’ | ‘\’ | ‘|’ | ‘-‘ | ‘+’ | ‘x’ | ‘o’ | ‘O’ | ‘.’ | ‘*’] joinstyle[‘miter’ | ‘round’ | ‘bevel’] labelstring or anything printable with ‘%s’ conversion. linestyleor ls[‘solid’ | ‘dashed’, ‘dashdot’, ‘dotted’ | (offset, on-off-dash-seq) | '-'|'--'|'-.'|':'|'None'|' '|'']linewidthor lwfloat or None for default path_effectsunknown picker[None|float|boolean|callable] rasterized[True | False | None] sketch_paramsunknown snapunknown transformTransforminstanceurla url string visible[True | False] zorderany number -
draw(artist, renderer, *args, **kwargs) -
Ellipses are normally drawn using an approximation that uses eight cubic bezier splines. The error of this approximation is 1.89818e-6, according to this unverified source:
Lancaster, Don. Approximating a Circle or an Ellipse Using Four Bezier Cubic Splines.
http://www.tinaja.com/glib/ellipse4.pdf
There is a use case where very large ellipses must be drawn with very high accuracy, and it is too expensive to render the entire ellipse with enough segments (either splines or line segments). Therefore, in the case where either radius of the ellipse is large enough that the error of the spline approximation will be visible (greater than one pixel offset from the ideal), a different technique is used.
In that case, only the visible parts of the ellipse are drawn, with each visible arc using a fixed number of spline segments (8). The algorithm proceeds as follows:
-
The points where the ellipse intersects the axes bounding box are located. (This is done be performing an inverse transformation on the axes bbox such that it is relative to the unit circle – this makes the intersection calculation much easier than doing rotated ellipse intersection directly).
This uses the “line intersecting a circle” algorithm from:
Vince, John. Geometry for Computer Graphics: Formulae, Examples & Proofs. London: Springer-Verlag, 2005.
- The angles of each of the intersection points are calculated.
- Proceeding counterclockwise starting in the positive x-direction, each of the visible arc-segments between the pairs of vertices are drawn using the bezier arc approximation technique implemented in
matplotlib.path.Path.arc().
-
-
class matplotlib.patches.Arrow(x, y, dx, dy, width=1.0, **kwargs) -
Bases:
matplotlib.patches.PatchAn arrow patch.
Draws an arrow, starting at (x, y), direction and length given by (dx, dy) the width of the arrow is scaled by width.
Valid kwargs are:
Property Description agg_filterunknown alphafloat or None animated[True | False] antialiasedor aa[True | False] or None for default axesan Axesinstancecapstyle[‘butt’ | ‘round’ | ‘projecting’] clip_boxa matplotlib.transforms.Bboxinstanceclip_on[True | False] clip_path[ ( Path,Transform) |Patch| None ]colormatplotlib color spec containsa callable function edgecoloror ecmpl color spec, or None for default, or ‘none’ for no color facecoloror fcmpl color spec, or None for default, or ‘none’ for no color figurea matplotlib.figure.Figureinstancefill[True | False] gidan id string hatch[‘/’ | ‘\’ | ‘|’ | ‘-‘ | ‘+’ | ‘x’ | ‘o’ | ‘O’ | ‘.’ | ‘*’] joinstyle[‘miter’ | ‘round’ | ‘bevel’] labelstring or anything printable with ‘%s’ conversion. linestyleor ls[‘solid’ | ‘dashed’, ‘dashdot’, ‘dotted’ | (offset, on-off-dash-seq) | '-'|'--'|'-.'|':'|'None'|' '|'']linewidthor lwfloat or None for default path_effectsunknown picker[None|float|boolean|callable] rasterized[True | False | None] sketch_paramsunknown snapunknown transformTransforminstanceurla url string visible[True | False] zorderany number -
get_patch_transform()
-
get_path()
-
-
class matplotlib.patches.ArrowStyle -
Bases:
matplotlib.patches._StyleArrowStyleis a container class which defines several arrowstyle classes, which is used to create an arrow path along a given path. These are mainly used withFancyArrowPatch.A arrowstyle object can be either created as:
ArrowStyle.Fancy(head_length=.4, head_width=.4, tail_width=.4)
or:
ArrowStyle("Fancy", head_length=.4, head_width=.4, tail_width=.4)or:
ArrowStyle("Fancy, head_length=.4, head_width=.4, tail_width=.4")The following classes are defined
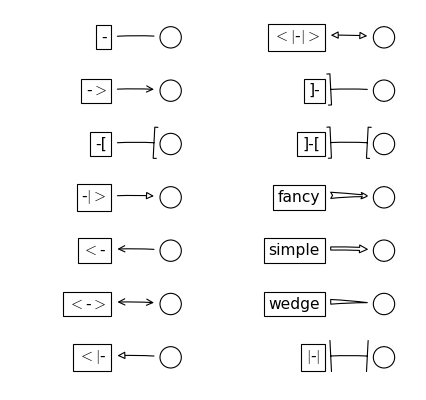
Class Name Attrs Curve -None CurveB ->head_length=0.4,head_width=0.2 BracketB -[widthB=1.0,lengthB=0.2,angleB=None CurveFilledB -|>head_length=0.4,head_width=0.2 CurveA <-head_length=0.4,head_width=0.2 CurveAB <->head_length=0.4,head_width=0.2 CurveFilledA <|-head_length=0.4,head_width=0.2 CurveFilledAB <|-|>head_length=0.4,head_width=0.2 BracketA ]-widthA=1.0,lengthA=0.2,angleA=None BracketAB ]-[widthA=1.0,lengthA=0.2,angleA=None,widthB=1.0,lengthB=0.2,angleB=None Fancy fancyhead_length=0.4,head_width=0.4,tail_width=0.4 Simple simplehead_length=0.5,head_width=0.5,tail_width=0.2 Wedge wedgetail_width=0.3,shrink_factor=0.5 BarAB |-|widthA=1.0,angleA=None,widthB=1.0,angleB=None An instance of any arrow style class is a callable object, whose call signature is:
__call__(self, path, mutation_size, linewidth, aspect_ratio=1.)
and it returns a tuple of a
Pathinstance and a boolean value. path is aPathinstance along which the arrow will be drawn. mutation_size and aspect_ratio have the same meaning as inBoxStyle. linewidth is a line width to be stroked. This is meant to be used to correct the location of the head so that it does not overshoot the destination point, but not all classes support it.(Source code, png, hires.png, pdf)
return the instance of the subclass with the given style name.
-
class BarAB(widthA=1.0, angleA=None, widthB=1.0, angleB=None) -
Bases:
matplotlib.patches._BracketAn arrow with a bar(|) at both ends.
- widthA
- width of the bracket
- lengthA
- length of the bracket
- angleA
- angle between the bracket and the line
- widthB
- width of the bracket
- lengthB
- length of the bracket
- angleB
- angle between the bracket and the line
-
class ArrowStyle.BracketA(widthA=1.0, lengthA=0.2, angleA=None) -
Bases:
matplotlib.patches._BracketAn arrow with a bracket(]) at its end.
- widthA
- width of the bracket
- lengthA
- length of the bracket
- angleA
- angle between the bracket and the line
-
class ArrowStyle.BracketAB(widthA=1.0, lengthA=0.2, angleA=None, widthB=1.0, lengthB=0.2, angleB=None) -
Bases:
matplotlib.patches._BracketAn arrow with a bracket(]) at both ends.
- widthA
- width of the bracket
- lengthA
- length of the bracket
- angleA
- angle between the bracket and the line
- widthB
- width of the bracket
- lengthB
- length of the bracket
- angleB
- angle between the bracket and the line
-
class ArrowStyle.BracketB(widthB=1.0, lengthB=0.2, angleB=None) -
Bases:
matplotlib.patches._BracketAn arrow with a bracket([) at its end.
- widthB
- width of the bracket
- lengthB
- length of the bracket
- angleB
- angle between the bracket and the line
-
class ArrowStyle.Curve -
Bases:
matplotlib.patches._CurveA simple curve without any arrow head.
-
class ArrowStyle.CurveA(head_length=0.4, head_width=0.2) -
Bases:
matplotlib.patches._CurveAn arrow with a head at its begin point.
- head_length
- length of the arrow head
- head_width
- width of the arrow head
-
class ArrowStyle.CurveAB(head_length=0.4, head_width=0.2) -
Bases:
matplotlib.patches._CurveAn arrow with heads both at the begin and the end point.
- head_length
- length of the arrow head
- head_width
- width of the arrow head
-
class ArrowStyle.CurveB(head_length=0.4, head_width=0.2) -
Bases:
matplotlib.patches._CurveAn arrow with a head at its end point.
- head_length
- length of the arrow head
- head_width
- width of the arrow head
-
class ArrowStyle.CurveFilledA(head_length=0.4, head_width=0.2) -
Bases:
matplotlib.patches._CurveAn arrow with filled triangle head at the begin.
- head_length
- length of the arrow head
- head_width
- width of the arrow head
-
class ArrowStyle.CurveFilledAB(head_length=0.4, head_width=0.2) -
Bases:
matplotlib.patches._CurveAn arrow with filled triangle heads both at the begin and the end point.
- head_length
- length of the arrow head
- head_width
- width of the arrow head
-
class ArrowStyle.CurveFilledB(head_length=0.4, head_width=0.2) -
Bases:
matplotlib.patches._CurveAn arrow with filled triangle head at the end.
- head_length
- length of the arrow head
- head_width
- width of the arrow head
-
class ArrowStyle.Fancy(head_length=0.4, head_width=0.4, tail_width=0.4) -
Bases:
matplotlib.patches._BaseA fancy arrow. Only works with a quadratic bezier curve.
- head_length
- length of the arrow head
- head_with
- width of the arrow head
- tail_width
- width of the arrow tail
-
transmute(path, mutation_size, linewidth)
-
class ArrowStyle.Simple(head_length=0.5, head_width=0.5, tail_width=0.2) -
Bases:
matplotlib.patches._BaseA simple arrow. Only works with a quadratic bezier curve.
- head_length
- length of the arrow head
- head_with
- width of the arrow head
- tail_width
- width of the arrow tail
-
transmute(path, mutation_size, linewidth)
-
class ArrowStyle.Wedge(tail_width=0.3, shrink_factor=0.5) -
Bases:
matplotlib.patches._BaseWedge(?) shape. Only works with a quadratic bezier curve. The begin point has a width of the tail_width and the end point has a width of 0. At the middle, the width is shrink_factor*tail_width.
- tail_width
- width of the tail
- shrink_factor
- fraction of the arrow width at the middle point
-
transmute(path, mutation_size, linewidth)
-
-
class matplotlib.patches.BoxStyle -
Bases:
matplotlib.patches._StyleBoxStyleis a container class which defines several boxstyle classes, which are used forFancyBboxPatch.A style object can be created as:
BoxStyle.Round(pad=0.2)
or:
BoxStyle("Round", pad=0.2)or:
BoxStyle("Round, pad=0.2")Following boxstyle classes are defined.
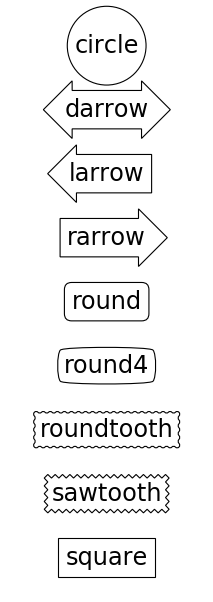
Class Name Attrs Circle circlepad=0.3 DArrow darrowpad=0.3 LArrow larrowpad=0.3 RArrow rarrowpad=0.3 Round roundpad=0.3,rounding_size=None Round4 round4pad=0.3,rounding_size=None Roundtooth roundtoothpad=0.3,tooth_size=None Sawtooth sawtoothpad=0.3,tooth_size=None Square squarepad=0.3 An instance of any boxstyle class is an callable object, whose call signature is:
__call__(self, x0, y0, width, height, mutation_size, aspect_ratio=1.)
and returns a
Pathinstance. x0, y0, width and height specify the location and size of the box to be drawn. mutation_scale determines the overall size of the mutation (by which I mean the transformation of the rectangle to the fancy box). mutation_aspect determines the aspect-ratio of the mutation.(Source code, png, hires.png, pdf)
return the instance of the subclass with the given style name.
-
class Circle(pad=0.3) -
Bases:
matplotlib.patches._BaseA simple circle box.
Parameters: pad : float
The amount of padding around the original box.
-
transmute(x0, y0, width, height, mutation_size)
-
-
class BoxStyle.DArrow(pad=0.3) -
Bases:
matplotlib.patches._Base(Double) Arrow Box
-
transmute(x0, y0, width, height, mutation_size)
-
-
class BoxStyle.LArrow(pad=0.3) -
Bases:
matplotlib.patches._Base(left) Arrow Box
-
transmute(x0, y0, width, height, mutation_size)
-
-
class BoxStyle.RArrow(pad=0.3) -
Bases:
matplotlib.patches.LArrow(right) Arrow Box
-
transmute(x0, y0, width, height, mutation_size)
-
-
class BoxStyle.Round(pad=0.3, rounding_size=None) -
Bases:
matplotlib.patches._BaseA box with round corners.
- pad
- amount of padding
- rounding_size
- rounding radius of corners. pad if None
-
transmute(x0, y0, width, height, mutation_size)
-
class BoxStyle.Round4(pad=0.3, rounding_size=None) -
Bases:
matplotlib.patches._BaseAnother box with round edges.
- pad
- amount of padding
- rounding_size
- rounding size of edges. pad if None
-
transmute(x0, y0, width, height, mutation_size)
-
class BoxStyle.Roundtooth(pad=0.3, tooth_size=None) -
Bases:
matplotlib.patches.SawtoothA rounded tooth box.
- pad
- amount of padding
- tooth_size
- size of the sawtooth. pad* if None
-
transmute(x0, y0, width, height, mutation_size)
-
class BoxStyle.Sawtooth(pad=0.3, tooth_size=None) -
Bases:
matplotlib.patches._BaseA sawtooth box.
- pad
- amount of padding
- tooth_size
- size of the sawtooth. pad* if None
-
transmute(x0, y0, width, height, mutation_size)
-
class BoxStyle.Square(pad=0.3) -
Bases:
matplotlib.patches._BaseA simple square box.
- pad
- amount of padding
-
transmute(x0, y0, width, height, mutation_size)
-
-
class matplotlib.patches.Circle(xy, radius=5, **kwargs) -
Bases:
matplotlib.patches.EllipseA circle patch.
Create true circle at center xy = (x, y) with given radius. Unlike
CirclePolygonwhich is a polygonal approximation, this uses Bézier splines and is much closer to a scale-free circle.Valid kwargs are:
Property Description agg_filterunknown alphafloat or None animated[True | False] antialiasedor aa[True | False] or None for default axesan Axesinstancecapstyle[‘butt’ | ‘round’ | ‘projecting’] clip_boxa matplotlib.transforms.Bboxinstanceclip_on[True | False] clip_path[ ( Path,Transform) |Patch| None ]colormatplotlib color spec containsa callable function edgecoloror ecmpl color spec, or None for default, or ‘none’ for no color facecoloror fcmpl color spec, or None for default, or ‘none’ for no color figurea matplotlib.figure.Figureinstancefill[True | False] gidan id string hatch[‘/’ | ‘\’ | ‘|’ | ‘-‘ | ‘+’ | ‘x’ | ‘o’ | ‘O’ | ‘.’ | ‘*’] joinstyle[‘miter’ | ‘round’ | ‘bevel’] labelstring or anything printable with ‘%s’ conversion. linestyleor ls[‘solid’ | ‘dashed’, ‘dashdot’, ‘dotted’ | (offset, on-off-dash-seq) | '-'|'--'|'-.'|':'|'None'|' '|'']linewidthor lwfloat or None for default path_effectsunknown picker[None|float|boolean|callable] rasterized[True | False | None] sketch_paramsunknown snapunknown transformTransforminstanceurla url string visible[True | False] zorderany number -
get_radius() -
return the radius of the circle
-
radius -
return the radius of the circle
-
set_radius(radius) -
Set the radius of the circle
ACCEPTS: float
-
-
class matplotlib.patches.CirclePolygon(xy, radius=5, resolution=20, **kwargs) -
Bases:
matplotlib.patches.RegularPolygonA polygon-approximation of a circle patch.
Create a circle at xy = (x, y) with given radius. This circle is approximated by a regular polygon with resolution sides. For a smoother circle drawn with splines, see
Circle.Valid kwargs are:
Property Description agg_filterunknown alphafloat or None animated[True | False] antialiasedor aa[True | False] or None for default axesan Axesinstancecapstyle[‘butt’ | ‘round’ | ‘projecting’] clip_boxa matplotlib.transforms.Bboxinstanceclip_on[True | False] clip_path[ ( Path,Transform) |Patch| None ]colormatplotlib color spec containsa callable function edgecoloror ecmpl color spec, or None for default, or ‘none’ for no color facecoloror fcmpl color spec, or None for default, or ‘none’ for no color figurea matplotlib.figure.Figureinstancefill[True | False] gidan id string hatch[‘/’ | ‘\’ | ‘|’ | ‘-‘ | ‘+’ | ‘x’ | ‘o’ | ‘O’ | ‘.’ | ‘*’] joinstyle[‘miter’ | ‘round’ | ‘bevel’] labelstring or anything printable with ‘%s’ conversion. linestyleor ls[‘solid’ | ‘dashed’, ‘dashdot’, ‘dotted’ | (offset, on-off-dash-seq) | '-'|'--'|'-.'|':'|'None'|' '|'']linewidthor lwfloat or None for default path_effectsunknown picker[None|float|boolean|callable] rasterized[True | False | None] sketch_paramsunknown snapunknown transformTransforminstanceurla url string visible[True | False] zorderany number
-
class matplotlib.patches.ConnectionPatch(xyA, xyB, coordsA, coordsB=None, axesA=None, axesB=None, arrowstyle='-', arrow_transmuter=None, connectionstyle='arc3', connector=None, patchA=None, patchB=None, shrinkA=0.0, shrinkB=0.0, mutation_scale=10.0, mutation_aspect=None, clip_on=False, dpi_cor=1.0, **kwargs) -
Bases:
matplotlib.patches.FancyArrowPatchA
ConnectionPatchclass is to make connecting lines between two points (possibly in different axes).Connect point xyA in coordsA with point xyB in coordsB
Valid keys are
Key Description arrowstyle the arrow style connectionstyle the connection style relpos default is (0.5, 0.5) patchA default is bounding box of the text patchB default is None shrinkA default is 2 points shrinkB default is 2 points mutation_scale default is text size (in points) mutation_aspect default is 1. ? any key for matplotlib.patches.PathPatchcoordsA and coordsB are strings that indicate the coordinates of xyA and xyB.
Property Description ‘figure points’ points from the lower left corner of the figure ‘figure pixels’ pixels from the lower left corner of the figure ‘figure fraction’ 0,0 is lower left of figure and 1,1 is upper, right ‘axes points’ points from lower left corner of axes ‘axes pixels’ pixels from lower left corner of axes ‘axes fraction’ 0,1 is lower left of axes and 1,1 is upper right ‘data’ use the coordinate system of the object being annotated (default) ‘offset points’ Specify an offset (in points) from the xy value ‘polar’ you can specify theta, r for the annotation, even in cartesian plots. Note that if you are using a polar axes, you do not need to specify polar for the coordinate system since that is the native “data” coordinate system. -
draw(renderer) -
Draw.
-
get_annotation_clip() -
Return annotation_clip attribute. See
set_annotation_clip()for the meaning of return values.
-
get_path_in_displaycoord() -
Return the mutated path of the arrow in the display coord
-
set_annotation_clip(b) -
set annotation_clip attribute.
-
- True: the annotation will only be drawn when self.xy is inside the
-
axes.
-
- False: the annotation will always be drawn regardless of its
-
position.
- None: the self.xy will be checked only if xycoords is “data”
-
-
-
class matplotlib.patches.ConnectionStyle -
Bases:
matplotlib.patches._StyleConnectionStyleis a container class which defines several connectionstyle classes, which is used to create a path between two points. These are mainly used withFancyArrowPatch.A connectionstyle object can be either created as:
ConnectionStyle.Arc3(rad=0.2)
or:
ConnectionStyle("Arc3", rad=0.2)or:
ConnectionStyle("Arc3, rad=0.2")The following classes are defined
Class Name Attrs Angle angleangleA=90,angleB=0,rad=0.0 Angle3 angle3angleA=90,angleB=0 Arc arcangleA=0,angleB=0,armA=None,armB=None,rad=0.0 Arc3 arc3rad=0.0 Bar bararmA=0.0,armB=0.0,fraction=0.3,angle=None An instance of any connection style class is an callable object, whose call signature is:
__call__(self, posA, posB,
         patchA=None, patchB=None,
         shrinkA=2., shrinkB=2.)
and it returns a
Pathinstance. posA and posB are tuples of x,y coordinates of the two points to be connected. patchA (or patchB) is given, the returned path is clipped so that it start (or end) from the boundary of the patch. The path is further shrunk by shrinkA (or shrinkB) which is given in points.return the instance of the subclass with the given style name.
-
class Angle(angleA=90, angleB=0, rad=0.0) -
Bases:
matplotlib.patches._BaseCreates a picewise continuous quadratic bezier path between two points. The path has a one passing-through point placed at the intersecting point of two lines which crosses the start (or end) point and has a angle of angleA (or angleB). The connecting edges are rounded with rad.
- angleA
- starting angle of the path
- angleB
- ending angle of the path
- rad
- rounding radius of the edge
-
connect(posA, posB)
-
class ConnectionStyle.Angle3(angleA=90, angleB=0) -
Bases:
matplotlib.patches._BaseCreates a simple quadratic bezier curve between two points. The middle control points is placed at the intersecting point of two lines which crosses the start (or end) point and has a angle of angleA (or angleB).
- angleA
- starting angle of the path
- angleB
- ending angle of the path
-
connect(posA, posB)
-
class ConnectionStyle.Arc(angleA=0, angleB=0, armA=None, armB=None, rad=0.0) -
Bases:
matplotlib.patches._BaseCreates a picewise continuous quadratic bezier path between two points. The path can have two passing-through points, a point placed at the distance of armA and angle of angleA from point A, another point with respect to point B. The edges are rounded with rad.
- angleA :
- starting angle of the path
- angleB :
- ending angle of the path
- armA :
- length of the starting arm
- armB :
- length of the ending arm
- rad :
- rounding radius of the edges
-
connect(posA, posB)
-
class ConnectionStyle.Arc3(rad=0.0) -
Bases:
matplotlib.patches._BaseCreates a simple quadratic bezier curve between two points. The curve is created so that the middle contol points (C1) is located at the same distance from the start (C0) and end points(C2) and the distance of the C1 to the line connecting C0-C2 is rad times the distance of C0-C2.
- rad
- curvature of the curve.
-
connect(posA, posB)
-
class ConnectionStyle.Bar(armA=0.0, armB=0.0, fraction=0.3, angle=None) -
Bases:
matplotlib.patches._BaseA line with angle between A and B with armA and armB. One of the arms is extended so that they are connected in a right angle. The length of armA is determined by (armA + fraction x AB distance). Same for armB.
Parameters: armA : float
minimum length of armA
armB : float
minimum length of armB
fraction : float
a fraction of the distance between two points that will be added to armA and armB.
angle : float or None
angle of the connecting line (if None, parallel to A and B)
-
connect(posA, posB)
-
-
-
class matplotlib.patches.Ellipse(xy, width, height, angle=0.0, **kwargs) -
Bases:
matplotlib.patches.PatchA scale-free ellipse.
- xy
- center of ellipse
- width
- total length (diameter) of horizontal axis
- height
- total length (diameter) of vertical axis
- angle
- rotation in degrees (anti-clockwise)
Valid kwargs are:
Property Description agg_filterunknown alphafloat or None animated[True | False] antialiasedor aa[True | False] or None for default axesan Axesinstancecapstyle[‘butt’ | ‘round’ | ‘projecting’] clip_boxa matplotlib.transforms.Bboxinstanceclip_on[True | False] clip_path[ ( Path,Transform) |Patch| None ]colormatplotlib color spec containsa callable function edgecoloror ecmpl color spec, or None for default, or ‘none’ for no color facecoloror fcmpl color spec, or None for default, or ‘none’ for no color figurea matplotlib.figure.Figureinstancefill[True | False] gidan id string hatch[‘/’ | ‘\’ | ‘|’ | ‘-‘ | ‘+’ | ‘x’ | ‘o’ | ‘O’ | ‘.’ | ‘*’] joinstyle[‘miter’ | ‘round’ | ‘bevel’] labelstring or anything printable with ‘%s’ conversion. linestyleor ls[‘solid’ | ‘dashed’, ‘dashdot’, ‘dotted’ | (offset, on-off-dash-seq) | '-'|'--'|'-.'|':'|'None'|' '|'']linewidthor lwfloat or None for default path_effectsunknown picker[None|float|boolean|callable] rasterized[True | False | None] sketch_paramsunknown snapunknown transformTransforminstanceurla url string visible[True | False] zorderany number -
get_patch_transform()
-
get_path() -
Return the vertices of the rectangle
-
class matplotlib.patches.FancyArrow(x, y, dx, dy, width=0.001, length_includes_head=False, head_width=None, head_length=None, shape='full', overhang=0, head_starts_at_zero=False, **kwargs) -
Bases:
matplotlib.patches.PolygonLike Arrow, but lets you set head width and head height independently.
- Constructor arguments
-
- width: float (default: 0.001)
- width of full arrow tail
- length_includes_head: [True | False] (default: False)
- True if head is to be counted in calculating the length.
- head_width: float or None (default: 3*width)
- total width of the full arrow head
- head_length: float or None (default: 1.5 * head_width)
- length of arrow head
- shape: [‘full’, ‘left’, ‘right’] (default: ‘full’)
- draw the left-half, right-half, or full arrow
- overhang: float (default: 0)
- fraction that the arrow is swept back (0 overhang means triangular shape). Can be negative or greater than one.
- head_starts_at_zero: [True | False] (default: False)
- if True, the head starts being drawn at coordinate 0 instead of ending at coordinate 0.
Other valid kwargs (inherited from
Patch) are:Property Description agg_filterunknown alphafloat or None animated[True | False] antialiasedor aa[True | False] or None for default axesan Axesinstancecapstyle[‘butt’ | ‘round’ | ‘projecting’] clip_boxa matplotlib.transforms.Bboxinstanceclip_on[True | False] clip_path[ ( Path,Transform) |Patch| None ]colormatplotlib color spec containsa callable function edgecoloror ecmpl color spec, or None for default, or ‘none’ for no color facecoloror fcmpl color spec, or None for default, or ‘none’ for no color figurea matplotlib.figure.Figureinstancefill[True | False] gidan id string hatch[‘/’ | ‘\’ | ‘|’ | ‘-‘ | ‘+’ | ‘x’ | ‘o’ | ‘O’ | ‘.’ | ‘*’] joinstyle[‘miter’ | ‘round’ | ‘bevel’] labelstring or anything printable with ‘%s’ conversion. linestyleor ls[‘solid’ | ‘dashed’, ‘dashdot’, ‘dotted’ | (offset, on-off-dash-seq) | '-'|'--'|'-.'|':'|'None'|' '|'']linewidthor lwfloat or None for default path_effectsunknown picker[None|float|boolean|callable] rasterized[True | False | None] sketch_paramsunknown snapunknown transformTransforminstanceurla url string visible[True | False] zorderany number
-
class matplotlib.patches.FancyArrowPatch(posA=None, posB=None, path=None, arrowstyle='simple', arrow_transmuter=None, connectionstyle='arc3', connector=None, patchA=None, patchB=None, shrinkA=2.0, shrinkB=2.0, mutation_scale=1.0, mutation_aspect=None, dpi_cor=1.0, **kwargs) -
Bases:
matplotlib.patches.PatchA fancy arrow patch. It draws an arrow using the :class:ArrowStyle.
If posA and posB is given, a path connecting two point are created according to the connectionstyle. The path will be clipped with patchA and patchB and further shrunken by shrinkA and shrinkB. An arrow is drawn along this resulting path using the arrowstyle parameter. If path provided, an arrow is drawn along this path and patchA, patchB, shrinkA, and shrinkB are ignored.
The connectionstyle describes how posA and posB are connected. It can be an instance of the ConnectionStyle class (matplotlib.patches.ConnectionStlye) or a string of the connectionstyle name, with optional comma-separated attributes. The following connection styles are available.
Class Name Attrs Angle angleangleA=90,angleB=0,rad=0.0 Angle3 angle3angleA=90,angleB=0 Arc arcangleA=0,angleB=0,armA=None,armB=None,rad=0.0 Arc3 arc3rad=0.0 Bar bararmA=0.0,armB=0.0,fraction=0.3,angle=None The arrowstyle describes how the fancy arrow will be drawn. It can be string of the available arrowstyle names, with optional comma-separated attributes, or one of the ArrowStyle instance. The optional attributes are meant to be scaled with the mutation_scale. The following arrow styles are available.
Class Name Attrs Curve -None CurveB ->head_length=0.4,head_width=0.2 BracketB -[widthB=1.0,lengthB=0.2,angleB=None CurveFilledB -|>head_length=0.4,head_width=0.2 CurveA <-head_length=0.4,head_width=0.2 CurveAB <->head_length=0.4,head_width=0.2 CurveFilledA <|-head_length=0.4,head_width=0.2 CurveFilledAB <|-|>head_length=0.4,head_width=0.2 BracketA ]-widthA=1.0,lengthA=0.2,angleA=None BracketAB ]-[widthA=1.0,lengthA=0.2,angleA=None,widthB=1.0,lengthB=0.2,angleB=None Fancy fancyhead_length=0.4,head_width=0.4,tail_width=0.4 Simple simplehead_length=0.5,head_width=0.5,tail_width=0.2 Wedge wedgetail_width=0.3,shrink_factor=0.5 BarAB |-|widthA=1.0,angleA=None,widthB=1.0,angleB=None - mutation_scale : a value with which attributes of arrowstyle
- (e.g., head_length) will be scaled. default=1.
- mutation_aspect : The height of the rectangle will be
- squeezed by this value before the mutation and the mutated box will be stretched by the inverse of it. default=None.
Valid kwargs are:
Property Description agg_filterunknown alphafloat or None animated[True | False] antialiasedor aa[True | False] or None for default axesan Axesinstancecapstyle[‘butt’ | ‘round’ | ‘projecting’] clip_boxa matplotlib.transforms.Bboxinstanceclip_on[True | False] clip_path[ ( Path,Transform) |Patch| None ]colormatplotlib color spec containsa callable function edgecoloror ecmpl color spec, or None for default, or ‘none’ for no color facecoloror fcmpl color spec, or None for default, or ‘none’ for no color figurea matplotlib.figure.Figureinstancefill[True | False] gidan id string hatch[‘/’ | ‘\’ | ‘|’ | ‘-‘ | ‘+’ | ‘x’ | ‘o’ | ‘O’ | ‘.’ | ‘*’] joinstyle[‘miter’ | ‘round’ | ‘bevel’] labelstring or anything printable with ‘%s’ conversion. linestyleor ls[‘solid’ | ‘dashed’, ‘dashdot’, ‘dotted’ | (offset, on-off-dash-seq) | '-'|'--'|'-.'|':'|'None'|' '|'']linewidthor lwfloat or None for default path_effectsunknown picker[None|float|boolean|callable] rasterized[True | False | None] sketch_paramsunknown snapunknown transformTransforminstanceurla url string visible[True | False] zorderany number -
draw(renderer)
-
get_arrowstyle() -
Return the arrowstyle object
-
get_connectionstyle() -
Return the ConnectionStyle instance
-
get_dpi_cor() -
dpi_cor is currently used for linewidth-related things and shrink factor. Mutation scale is not affected by this.
-
get_mutation_aspect() -
Return the aspect ratio of the bbox mutation.
-
get_mutation_scale() -
Return the mutation scale.
-
get_path() -
return the path of the arrow in the data coordinate. Use get_path_in_displaycoord() method to retrieve the arrow path in the display coord.
-
get_path_in_displaycoord() -
Return the mutated path of the arrow in the display coord
-
set_arrowstyle(arrowstyle=None, **kw) -
Set the arrow style.
- arrowstyle can be a string with arrowstyle name with optional
-
comma-separated attributes. Alternatively, the attrs can be provided as keywords.
set_arrowstyle(“Fancy,head_length=0.2”) set_arrowstyle(“fancy”, head_length=0.2)
Old attrs simply are forgotten.
Without argument (or with arrowstyle=None), return available box styles as a list of strings.
-
set_connectionstyle(connectionstyle, **kw) -
Set the connection style.
- connectionstyle can be a string with connectionstyle name with
-
optional comma-separated attributes. Alternatively, the attrs can be provided as keywords.
set_connectionstyle(“arc,angleA=0,armA=30,rad=10”) set_connectionstyle(“arc”, angleA=0,armA=30,rad=10)
Old attrs simply are forgotten.
Without argument (or with connectionstyle=None), return available styles as a list of strings.
-
set_dpi_cor(dpi_cor) -
dpi_cor is currently used for linewidth-related things and shrink factor. Mutation scale is not affected by this.
-
set_mutation_aspect(aspect) -
Set the aspect ratio of the bbox mutation.
ACCEPTS: float
-
set_mutation_scale(scale) -
Set the mutation scale.
ACCEPTS: float
-
set_patchA(patchA) -
set the begin patch.
-
set_patchB(patchB) -
set the begin patch
-
set_positions(posA, posB) -
set the begin and end positions of the connecting path. Use current value if None.
-
class matplotlib.patches.FancyBboxPatch(xy, width, height, boxstyle='round', bbox_transmuter=None, mutation_scale=1.0, mutation_aspect=None, **kwargs) -
Bases:
matplotlib.patches.PatchDraw a fancy box around a rectangle with lower left at xy*=(*x, y) with specified width and height.
FancyBboxPatchclass is similar toRectangleclass, but it draws a fancy box around the rectangle. The transformation of the rectangle box to the fancy box is delegated to theBoxTransmuterBaseand its derived classes.xy = lower left corner
width, height
boxstyle determines what kind of fancy box will be drawn. It can be a string of the style name with a comma separated attribute, or an instance of
BoxStyle. Following box styles are available.Class Name Attrs Circle circlepad=0.3 DArrow darrowpad=0.3 LArrow larrowpad=0.3 RArrow rarrowpad=0.3 Round roundpad=0.3,rounding_size=None Round4 round4pad=0.3,rounding_size=None Roundtooth roundtoothpad=0.3,tooth_size=None Sawtooth sawtoothpad=0.3,tooth_size=None Square squarepad=0.3 mutation_scale : a value with which attributes of boxstyle (e.g., pad) will be scaled. default=1.
mutation_aspect : The height of the rectangle will be squeezed by this value before the mutation and the mutated box will be stretched by the inverse of it. default=None.
Valid kwargs are:
Property Description agg_filterunknown alphafloat or None animated[True | False] antialiasedor aa[True | False] or None for default axesan Axesinstancecapstyle[‘butt’ | ‘round’ | ‘projecting’] clip_boxa matplotlib.transforms.Bboxinstanceclip_on[True | False] clip_path[ ( Path,Transform) |Patch| None ]colormatplotlib color spec containsa callable function edgecoloror ecmpl color spec, or None for default, or ‘none’ for no color facecoloror fcmpl color spec, or None for default, or ‘none’ for no color figurea matplotlib.figure.Figureinstancefill[True | False] gidan id string hatch[‘/’ | ‘\’ | ‘|’ | ‘-‘ | ‘+’ | ‘x’ | ‘o’ | ‘O’ | ‘.’ | ‘*’] joinstyle[‘miter’ | ‘round’ | ‘bevel’] labelstring or anything printable with ‘%s’ conversion. linestyleor ls[‘solid’ | ‘dashed’, ‘dashdot’, ‘dotted’ | (offset, on-off-dash-seq) | '-'|'--'|'-.'|':'|'None'|' '|'']linewidthor lwfloat or None for default path_effectsunknown picker[None|float|boolean|callable] rasterized[True | False | None] sketch_paramsunknown snapunknown transformTransforminstanceurla url string visible[True | False] zorderany number -
get_bbox()
-
get_boxstyle() -
Return the boxstyle object
-
get_height() -
Return the height of the rectangle
-
get_mutation_aspect() -
Return the aspect ratio of the bbox mutation.
-
get_mutation_scale() -
Return the mutation scale.
-
get_path() -
Return the mutated path of the rectangle
-
get_width() -
Return the width of the rectangle
-
get_x() -
Return the left coord of the rectangle
-
get_y() -
Return the bottom coord of the rectangle
-
set_bounds(*args) -
Set the bounds of the rectangle: l,b,w,h
ACCEPTS: (left, bottom, width, height)
-
set_boxstyle(boxstyle=None, **kw) -
Set the box style.
boxstyle can be a string with boxstyle name with optional comma-separated attributes. Alternatively, the attrs can be provided as keywords:
set_boxstyle("round,pad=0.2")
set_boxstyle("round", pad=0.2)
Old attrs simply are forgotten.
Without argument (or with boxstyle = None), it returns available box styles.
The following boxstyles are available:
Class Name Attrs Circle circlepad=0.3 DArrow darrowpad=0.3 LArrow larrowpad=0.3 RArrow rarrowpad=0.3 Round roundpad=0.3,rounding_size=None Round4 round4pad=0.3,rounding_size=None Roundtooth roundtoothpad=0.3,tooth_size=None Sawtooth sawtoothpad=0.3,tooth_size=None Square squarepad=0.3 ACCEPTS: [ ‘circle’ | ‘darrow’ | ‘larrow’ | ‘rarrow’ | ‘round’ | ‘round4’ | ‘roundtooth’ | ‘sawtooth’ | ‘square’ ]
-
set_height(h) -
Set the width rectangle
ACCEPTS: float
-
set_mutation_aspect(aspect) -
Set the aspect ratio of the bbox mutation.
ACCEPTS: float
-
set_mutation_scale(scale) -
Set the mutation scale.
ACCEPTS: float
-
set_width(w) -
Set the width rectangle
ACCEPTS: float
-
set_x(x) -
Set the left coord of the rectangle
ACCEPTS: float
-
set_y(y) -
Set the bottom coord of the rectangle
ACCEPTS: float
-
-
class matplotlib.patches.Patch(edgecolor=None, facecolor=None, color=None, linewidth=None, linestyle=None, antialiased=None, hatch=None, fill=True, capstyle=None, joinstyle=None, **kwargs) -
Bases:
matplotlib.artist.ArtistA patch is a 2D artist with a face color and an edge color.
If any of edgecolor, facecolor, linewidth, or antialiased are None, they default to their rc params setting.
The following kwarg properties are supported
Property Description agg_filterunknown alphafloat or None animated[True | False] antialiasedor aa[True | False] or None for default axesan Axesinstancecapstyle[‘butt’ | ‘round’ | ‘projecting’] clip_boxa matplotlib.transforms.Bboxinstanceclip_on[True | False] clip_path[ ( Path,Transform) |Patch| None ]colormatplotlib color spec containsa callable function edgecoloror ecmpl color spec, or None for default, or ‘none’ for no color facecoloror fcmpl color spec, or None for default, or ‘none’ for no color figurea matplotlib.figure.Figureinstancefill[True | False] gidan id string hatch[‘/’ | ‘\’ | ‘|’ | ‘-‘ | ‘+’ | ‘x’ | ‘o’ | ‘O’ | ‘.’ | ‘*’] joinstyle[‘miter’ | ‘round’ | ‘bevel’] labelstring or anything printable with ‘%s’ conversion. linestyleor ls[‘solid’ | ‘dashed’, ‘dashdot’, ‘dotted’ | (offset, on-off-dash-seq) | '-'|'--'|'-.'|':'|'None'|' '|'']linewidthor lwfloat or None for default path_effectsunknown picker[None|float|boolean|callable] rasterized[True | False | None] sketch_paramsunknown snapunknown transformTransforminstanceurla url string visible[True | False] zorderany number -
contains(mouseevent, radius=None) -
Test whether the mouse event occurred in the patch.
Returns T/F, {}
-
contains_point(point, radius=None) -
Returns True if the given point is inside the path (transformed with its transform attribute).
-
draw(artist, renderer, *args, **kwargs) -
Draw the
Patchto the given renderer.
-
fill -
return whether fill is set
-
get_aa() -
Returns True if the
Patchis to be drawn with antialiasing.
-
get_antialiased() -
Returns True if the
Patchis to be drawn with antialiasing.
-
get_capstyle() -
Return the current capstyle
-
get_data_transform() -
Return the
Transforminstance which maps data coordinates to physical coordinates.
-
get_ec() -
Return the edge color of the
Patch.
-
get_edgecolor() -
Return the edge color of the
Patch.
-
get_facecolor() -
Return the face color of the
Patch.
-
get_fc() -
Return the face color of the
Patch.
-
get_fill() -
return whether fill is set
-
get_hatch() -
Return the current hatching pattern
-
get_joinstyle() -
Return the current joinstyle
-
get_linestyle() -
Return the linestyle. Will be one of [‘solid’ | ‘dashed’ | ‘dashdot’ | ‘dotted’]
-
get_linewidth() -
Return the line width in points.
-
get_ls() -
Return the linestyle. Will be one of [‘solid’ | ‘dashed’ | ‘dashdot’ | ‘dotted’]
-
get_lw() -
Return the line width in points.
-
get_patch_transform() -
Return the
Transforminstance which takes patch coordinates to data coordinates.For example, one may define a patch of a circle which represents a radius of 5 by providing coordinates for a unit circle, and a transform which scales the coordinates (the patch coordinate) by 5.
-
get_path() -
Return the path of this patch
-
get_verts() -
Return a copy of the vertices used in this patch
If the patch contains Bezier curves, the curves will be interpolated by line segments. To access the curves as curves, use
get_path().
-
get_window_extent(renderer=None)
-
set_aa(aa) -
alias for set_antialiased
-
set_alpha(alpha) -
Set the alpha tranparency of the patch.
ACCEPTS: float or None
-
set_antialiased(aa) -
Set whether to use antialiased rendering
ACCEPTS: [True | False] or None for default
-
set_capstyle(s) -
Set the patch capstyle
ACCEPTS: [‘butt’ | ‘round’ | ‘projecting’]
-
set_color(c) -
Set both the edgecolor and the facecolor.
ACCEPTS: matplotlib color spec
See also
-
set_facecolor(),set_edgecolor() - For setting the edge or face color individually.
-
-
set_ec(color) -
alias for set_edgecolor
-
set_edgecolor(color) -
Set the patch edge color
ACCEPTS: mpl color spec, or None for default, or ‘none’ for no color
-
set_facecolor(color) -
Set the patch face color
ACCEPTS: mpl color spec, or None for default, or ‘none’ for no color
-
set_fc(color) -
alias for set_facecolor
-
set_fill(b) -
Set whether to fill the patch
ACCEPTS: [True | False]
-
set_hatch(hatch) -
Set the hatching pattern
hatch can be one of:
/   - diagonal hatching
\   - back diagonal
|   - vertical
-   - horizontal
+   - crossed
x   - crossed diagonal
o   - small circle
O   - large circle
.   - dots
*   - stars
Letters can be combined, in which case all the specified hatchings are done. If same letter repeats, it increases the density of hatching of that pattern.
Hatching is supported in the PostScript, PDF, SVG and Agg backends only.
ACCEPTS: [‘/’ | ‘\’ | ‘|’ | ‘-‘ | ‘+’ | ‘x’ | ‘o’ | ‘O’ | ‘.’ | ‘*’]
-
set_joinstyle(s) -
Set the patch joinstyle
ACCEPTS: [‘miter’ | ‘round’ | ‘bevel’]
-
set_linestyle(ls) -
Set the patch linestyle
linestyle description '-'or'solid'solid line '--'or'dashed'dashed line '-.'or'dashdot'dash-dotted line ':'or'dotted'dotted line Alternatively a dash tuple of the following form can be provided:
(offset, onoffseq),
where
onoffseqis an even length tuple of on and off ink in points.- ACCEPTS: [‘solid’ | ‘dashed’, ‘dashdot’, ‘dotted’ |
- (offset, on-off-dash-seq) |
'-'|'--'|'-.'|':'|'None'|' '|'']
Parameters: ls : { ‘-‘, ‘–’, ‘-.’, ‘:’} and more see description
The line style.
-
set_linewidth(w) -
Set the patch linewidth in points
ACCEPTS: float or None for default
-
set_ls(ls) -
alias for set_linestyle
-
set_lw(lw) -
alias for set_linewidth
-
update_from(other) -
Updates this
Patchfrom the properties of other.
-
validCap = ('butt', 'round', 'projecting')
-
validJoin = ('miter', 'round', 'bevel')
-
zorder = 1
-
-
class matplotlib.patches.PathPatch(path, **kwargs) -
Bases:
matplotlib.patches.PatchA general polycurve path patch.
path is a
matplotlib.path.Pathobject.Valid kwargs are:
Property Description agg_filterunknown alphafloat or None animated[True | False] antialiasedor aa[True | False] or None for default axesan Axesinstancecapstyle[‘butt’ | ‘round’ | ‘projecting’] clip_boxa matplotlib.transforms.Bboxinstanceclip_on[True | False] clip_path[ ( Path,Transform) |Patch| None ]colormatplotlib color spec containsa callable function edgecoloror ecmpl color spec, or None for default, or ‘none’ for no color facecoloror fcmpl color spec, or None for default, or ‘none’ for no color figurea matplotlib.figure.Figureinstancefill[True | False] gidan id string hatch[‘/’ | ‘\’ | ‘|’ | ‘-‘ | ‘+’ | ‘x’ | ‘o’ | ‘O’ | ‘.’ | ‘*’] joinstyle[‘miter’ | ‘round’ | ‘bevel’] labelstring or anything printable with ‘%s’ conversion. linestyleor ls[‘solid’ | ‘dashed’, ‘dashdot’, ‘dotted’ | (offset, on-off-dash-seq) | '-'|'--'|'-.'|':'|'None'|' '|'']linewidthor lwfloat or None for default path_effectsunknown picker[None|float|boolean|callable] rasterized[True | False | None] sketch_paramsunknown snapunknown transformTransforminstanceurla url string visible[True | False] zorderany number See also
-
Patch - For additional kwargs
-
get_path()
-
-
class matplotlib.patches.Polygon(xy, closed=True, **kwargs) -
Bases:
matplotlib.patches.PatchA general polygon patch.
xy is a numpy array with shape Nx2.
If closed is True, the polygon will be closed so the starting and ending points are the same.
Valid kwargs are:
Property Description agg_filterunknown alphafloat or None animated[True | False] antialiasedor aa[True | False] or None for default axesan Axesinstancecapstyle[‘butt’ | ‘round’ | ‘projecting’] clip_boxa matplotlib.transforms.Bboxinstanceclip_on[True | False] clip_path[ ( Path,Transform) |Patch| None ]colormatplotlib color spec containsa callable function edgecoloror ecmpl color spec, or None for default, or ‘none’ for no color facecoloror fcmpl color spec, or None for default, or ‘none’ for no color figurea matplotlib.figure.Figureinstancefill[True | False] gidan id string hatch[‘/’ | ‘\’ | ‘|’ | ‘-‘ | ‘+’ | ‘x’ | ‘o’ | ‘O’ | ‘.’ | ‘*’] joinstyle[‘miter’ | ‘round’ | ‘bevel’] labelstring or anything printable with ‘%s’ conversion. linestyleor ls[‘solid’ | ‘dashed’, ‘dashdot’, ‘dotted’ | (offset, on-off-dash-seq) | '-'|'--'|'-.'|':'|'None'|' '|'']linewidthor lwfloat or None for default path_effectsunknown picker[None|float|boolean|callable] rasterized[True | False | None] sketch_paramsunknown snapunknown transformTransforminstanceurla url string visible[True | False] zorderany number See also
-
Patch - For additional kwargs
-
get_closed() -
Returns if the polygon is closed
Returns: closed : bool
If the path is closed
-
get_path() -
Get the path of the polygon
Returns: path : Path
The
Pathobject for the polygon
-
get_xy() -
Get the vertices of the path
Returns: vertices : numpy array
The coordinates of the vertices as a Nx2 ndarray.
-
set_closed(closed) -
Set if the polygon is closed
Parameters: closed : bool
True if the polygon is closed
-
set_xy(xy) -
Set the vertices of the polygon
Parameters: xy : numpy array or iterable of pairs
The coordinates of the vertices as a Nx2 ndarray or iterable of pairs.
-
-
class matplotlib.patches.Rectangle(xy, width, height, angle=0.0, **kwargs) -
Bases:
matplotlib.patches.PatchDraw a rectangle with lower left at xy = (x, y) with specified width and height.
- angle
- rotation in degrees (anti-clockwise)
fill is a boolean indicating whether to fill the rectangle
Valid kwargs are:
Property Description agg_filterunknown alphafloat or None animated[True | False] antialiasedor aa[True | False] or None for default axesan Axesinstancecapstyle[‘butt’ | ‘round’ | ‘projecting’] clip_boxa matplotlib.transforms.Bboxinstanceclip_on[True | False] clip_path[ ( Path,Transform) |Patch| None ]colormatplotlib color spec containsa callable function edgecoloror ecmpl color spec, or None for default, or ‘none’ for no color facecoloror fcmpl color spec, or None for default, or ‘none’ for no color figurea matplotlib.figure.Figureinstancefill[True | False] gidan id string hatch[‘/’ | ‘\’ | ‘|’ | ‘-‘ | ‘+’ | ‘x’ | ‘o’ | ‘O’ | ‘.’ | ‘*’] joinstyle[‘miter’ | ‘round’ | ‘bevel’] labelstring or anything printable with ‘%s’ conversion. linestyleor ls[‘solid’ | ‘dashed’, ‘dashdot’, ‘dotted’ | (offset, on-off-dash-seq) | '-'|'--'|'-.'|':'|'None'|' '|'']linewidthor lwfloat or None for default path_effectsunknown picker[None|float|boolean|callable] rasterized[True | False | None] sketch_paramsunknown snapunknown transformTransforminstanceurla url string visible[True | False] zorderany number -
get_bbox()
-
get_height() -
Return the height of the rectangle
-
get_patch_transform()
-
get_path() -
Return the vertices of the rectangle
-
get_width() -
Return the width of the rectangle
-
get_x() -
Return the left coord of the rectangle
-
get_xy() -
Return the left and bottom coords of the rectangle
-
get_y() -
Return the bottom coord of the rectangle
-
set_bounds(*args) -
Set the bounds of the rectangle: l,b,w,h
ACCEPTS: (left, bottom, width, height)
-
set_height(h) -
Set the width rectangle
ACCEPTS: float
-
set_width(w) -
Set the width rectangle
ACCEPTS: float
-
set_x(x) -
Set the left coord of the rectangle
ACCEPTS: float
-
set_xy(xy) -
Set the left and bottom coords of the rectangle
ACCEPTS: 2-item sequence
-
set_y(y) -
Set the bottom coord of the rectangle
ACCEPTS: float
-
xy -
Return the left and bottom coords of the rectangle
-
class matplotlib.patches.RegularPolygon(xy, numVertices, radius=5, orientation=0, **kwargs) -
Bases:
matplotlib.patches.PatchA regular polygon patch.
Constructor arguments:
- xy
- A length 2 tuple (x, y) of the center.
- numVertices
- the number of vertices.
- radius
- The distance from the center to each of the vertices.
- orientation
- rotates the polygon (in radians).
Valid kwargs are:
Property Description agg_filterunknown alphafloat or None animated[True | False] antialiasedor aa[True | False] or None for default axesan Axesinstancecapstyle[‘butt’ | ‘round’ | ‘projecting’] clip_boxa matplotlib.transforms.Bboxinstanceclip_on[True | False] clip_path[ ( Path,Transform) |Patch| None ]colormatplotlib color spec containsa callable function edgecoloror ecmpl color spec, or None for default, or ‘none’ for no color facecoloror fcmpl color spec, or None for default, or ‘none’ for no color figurea matplotlib.figure.Figureinstancefill[True | False] gidan id string hatch[‘/’ | ‘\’ | ‘|’ | ‘-‘ | ‘+’ | ‘x’ | ‘o’ | ‘O’ | ‘.’ | ‘*’] joinstyle[‘miter’ | ‘round’ | ‘bevel’] labelstring or anything printable with ‘%s’ conversion. linestyleor ls[‘solid’ | ‘dashed’, ‘dashdot’, ‘dotted’ | (offset, on-off-dash-seq) | '-'|'--'|'-.'|':'|'None'|' '|'']linewidthor lwfloat or None for default path_effectsunknown picker[None|float|boolean|callable] rasterized[True | False | None] sketch_paramsunknown snapunknown transformTransforminstanceurla url string visible[True | False] zorderany number -
get_patch_transform()
-
get_path()
-
numvertices
-
orientation
-
radius
-
xy
-
class matplotlib.patches.Shadow(patch, ox, oy, props=None, **kwargs) -
Bases:
matplotlib.patches.PatchCreate a shadow of the given patch offset by ox, oy. props, if not None, is a patch property update dictionary. If None, the shadow will have have the same color as the face, but darkened.
kwargs are
Property Description agg_filterunknown alphafloat or None animated[True | False] antialiasedor aa[True | False] or None for default axesan Axesinstancecapstyle[‘butt’ | ‘round’ | ‘projecting’] clip_boxa matplotlib.transforms.Bboxinstanceclip_on[True | False] clip_path[ ( Path,Transform) |Patch| None ]colormatplotlib color spec containsa callable function edgecoloror ecmpl color spec, or None for default, or ‘none’ for no color facecoloror fcmpl color spec, or None for default, or ‘none’ for no color figurea matplotlib.figure.Figureinstancefill[True | False] gidan id string hatch[‘/’ | ‘\’ | ‘|’ | ‘-‘ | ‘+’ | ‘x’ | ‘o’ | ‘O’ | ‘.’ | ‘*’] joinstyle[‘miter’ | ‘round’ | ‘bevel’] labelstring or anything printable with ‘%s’ conversion. linestyleor ls[‘solid’ | ‘dashed’, ‘dashdot’, ‘dotted’ | (offset, on-off-dash-seq) | '-'|'--'|'-.'|':'|'None'|' '|'']linewidthor lwfloat or None for default path_effectsunknown picker[None|float|boolean|callable] rasterized[True | False | None] sketch_paramsunknown snapunknown transformTransforminstanceurla url string visible[True | False] zorderany number -
draw(renderer)
-
get_patch_transform()
-
get_path()
-
-
class matplotlib.patches.Wedge(center, r, theta1, theta2, width=None, **kwargs) -
Bases:
matplotlib.patches.PatchWedge shaped patch.
Draw a wedge centered at x, y center with radius r that sweeps theta1 to theta2 (in degrees). If width is given, then a partial wedge is drawn from inner radius r - width to outer radius r.
Valid kwargs are:
Property Description agg_filterunknown alphafloat or None animated[True | False] antialiasedor aa[True | False] or None for default axesan Axesinstancecapstyle[‘butt’ | ‘round’ | ‘projecting’] clip_boxa matplotlib.transforms.Bboxinstanceclip_on[True | False] clip_path[ ( Path,Transform) |Patch| None ]colormatplotlib color spec containsa callable function edgecoloror ecmpl color spec, or None for default, or ‘none’ for no color facecoloror fcmpl color spec, or None for default, or ‘none’ for no color figurea matplotlib.figure.Figureinstancefill[True | False] gidan id string hatch[‘/’ | ‘\’ | ‘|’ | ‘-‘ | ‘+’ | ‘x’ | ‘o’ | ‘O’ | ‘.’ | ‘*’] joinstyle[‘miter’ | ‘round’ | ‘bevel’] labelstring or anything printable with ‘%s’ conversion. linestyleor ls[‘solid’ | ‘dashed’, ‘dashdot’, ‘dotted’ | (offset, on-off-dash-seq) | '-'|'--'|'-.'|':'|'None'|' '|'']linewidthor lwfloat or None for default path_effectsunknown picker[None|float|boolean|callable] rasterized[True | False | None] sketch_paramsunknown snapunknown transformTransforminstanceurla url string visible[True | False] zorderany number -
get_path()
-
set_center(center)
-
set_radius(radius)
-
set_theta1(theta1)
-
set_theta2(theta2)
-
set_width(width)
-
-
class matplotlib.patches.YAArrow(figure, xytip, xybase, width=4, frac=0.1, headwidth=12, **kwargs) -
Bases:
matplotlib.patches.PatchYet another arrow class.
This is an arrow that is defined in display space and has a tip at x1, y1 and a base at x2, y2.
Constructor arguments:
- xytip
- (x, y) location of arrow tip
- xybase
- (x, y) location the arrow base mid point
- figure
- The
Figureinstance (fig.dpi) - width
- The width of the arrow in points
- frac
- The fraction of the arrow length occupied by the head
- headwidth
- The width of the base of the arrow head in points
Valid kwargs are:
Property Description agg_filterunknown alphafloat or None animated[True | False] antialiasedor aa[True | False] or None for default axesan Axesinstancecapstyle[‘butt’ | ‘round’ | ‘projecting’] clip_boxa matplotlib.transforms.Bboxinstanceclip_on[True | False] clip_path[ ( Path,Transform) |Patch| None ]colormatplotlib color spec containsa callable function edgecoloror ecmpl color spec, or None for default, or ‘none’ for no color facecoloror fcmpl color spec, or None for default, or ‘none’ for no color figurea matplotlib.figure.Figureinstancefill[True | False] gidan id string hatch[‘/’ | ‘\’ | ‘|’ | ‘-‘ | ‘+’ | ‘x’ | ‘o’ | ‘O’ | ‘.’ | ‘*’] joinstyle[‘miter’ | ‘round’ | ‘bevel’] labelstring or anything printable with ‘%s’ conversion. linestyleor ls[‘solid’ | ‘dashed’, ‘dashdot’, ‘dotted’ | (offset, on-off-dash-seq) | '-'|'--'|'-.'|':'|'None'|' '|'']linewidthor lwfloat or None for default path_effectsunknown picker[None|float|boolean|callable] rasterized[True | False | None] sketch_paramsunknown snapunknown transformTransforminstanceurla url string visible[True | False] zorderany number -
get_patch_transform()
-
get_path()
-
getpoints(x1, y1, x2, y2, k) -
For line segment defined by (x1, y1) and (x2, y2) return the points on the line that is perpendicular to the line and intersects (x2, y2) and the distance from (x2, y2) of the returned points is k.
-
matplotlib.patches.bbox_artist(artist, renderer, props=None, fill=True) -
This is a debug function to draw a rectangle around the bounding box returned by
get_window_extent()of an artist, to test whether the artist is returning the correct bbox.props is a dict of rectangle props with the additional property ‘pad’ that sets the padding around the bbox in points.
-
matplotlib.patches.draw_bbox(bbox, renderer, color='k', trans=None) -
This is a debug function to draw a rectangle around the bounding box returned by
get_window_extent()of an artist, to test whether the artist is returning the correct bbox.
© 2012–2016 Matplotlib Development Team. All rights reserved.
Licensed under the Matplotlib License Agreement.
http://matplotlib.org/1.5.3/api/patches_api.html