W3cubDocs
/Matplotlib 1.5figure
matplotlib.figure
The figure module provides the top-level Artist, the Figure, which contains all the plot elements. The following classes are defined
-
SubplotParams - control the default spacing of the subplots
-
Figure - top level container for all plot elements
-
class matplotlib.figure.AxesStack -
Bases:
matplotlib.cbook.StackSpecialization of the Stack to handle all tracking of Axes in a Figure. This stack stores
key, (ind, axes)pairs, where:- key should be a hash of the args and kwargs used in generating the Axes.
- ind is a serial number for tracking the order in which axes were added.
The AxesStack is a callable, where
ax_stack()returns the current axes. Alternatively thecurrent_key_axes()will return the current key and associated axes.-
add(key, a) -
Add Axes a, with key key, to the stack, and return the stack.
If a is already on the stack, don’t add it again, but return None.
-
as_list() -
Return a list of the Axes instances that have been added to the figure
-
bubble(a) -
Move the given axes, which must already exist in the stack, to the top.
-
current_key_axes() -
Return a tuple of
(key, axes)for the active axes.If no axes exists on the stack, then returns
(None, None).
-
get(key) -
Return the Axes instance that was added with key. If it is not present, return None.
-
remove(a) -
Remove the axes from the stack.
-
class matplotlib.figure.Figure(figsize=None, dpi=None, facecolor=None, edgecolor=None, linewidth=0.0, frameon=None, subplotpars=None, tight_layout=None) -
Bases:
matplotlib.artist.ArtistThe Figure instance supports callbacks through a callbacks attribute which is a
matplotlib.cbook.CallbackRegistryinstance. The events you can connect to are ‘dpi_changed’, and the callback will be called withfunc(fig)where fig is theFigureinstance.- patch
- The figure patch is drawn by a
matplotlib.patches.Rectangleinstance - suppressComposite
- For multiple figure images, the figure will make composite images depending on the renderer option_image_nocomposite function. If suppressComposite is True|False, this will override the renderer.
- figsize
- w,h tuple in inches
- dpi
- Dots per inch
- facecolor
- The figure patch facecolor; defaults to rc
figure.facecolor - edgecolor
- The figure patch edge color; defaults to rc
figure.edgecolor - linewidth
- The figure patch edge linewidth; the default linewidth of the frame
- frameon
- If False, suppress drawing the figure frame
- subplotpars
- A
SubplotParamsinstance, defaults to rc - tight_layout
- If False use subplotpars; if True adjust subplot parameters using
tight_layout()with default padding. When providing a dict containing the keyspad,w_pad,h_padandrect, the defaulttight_layout()paddings will be overridden. Defaults to rcfigure.autolayout.
-
add_axes(*args, **kwargs) -
Add an axes at position rect [left, bottom, width, height] where all quantities are in fractions of figure width and height. kwargs are legal
Axeskwargs plus projection which sets the projection type of the axes. (For backward compatibility,polar=Truemay also be provided, which is equivalent toprojection='polar'). Valid values for projection are: [‘aitoff’, ‘hammer’, ‘lambert’, ‘mollweide’, ‘polar’, ‘rectilinear’]. Some of these projections support additional kwargs, which may be provided toadd_axes(). Typical usage:rect = l,b,w,h fig.add_axes(rect) fig.add_axes(rect, frameon=False, axisbg='g') fig.add_axes(rect, polar=True) fig.add_axes(rect, projection='polar') fig.add_axes(ax)
If the figure already has an axes with the same parameters, then it will simply make that axes current and return it. If you do not want this behavior, e.g., you want to force the creation of a new Axes, you must use a unique set of args and kwargs. The axes
labelattribute has been exposed for this purpose. e.g., if you want two axes that are otherwise identical to be added to the figure, make sure you give them unique labels:fig.add_axes(rect, label='axes1') fig.add_axes(rect, label='axes2')
In rare circumstances, add_axes may be called with a single argument, an Axes instance already created in the present figure but not in the figure’s list of axes. For example, if an axes has been removed with
delaxes(), it can be restored with:fig.add_axes(ax)
In all cases, the
Axesinstance will be returned.In addition to projection, the following kwargs are supported:
Property Description adjustable[ ‘box’ | ‘datalim’ | ‘box-forced’] agg_filterunknown alphafloat (0.0 transparent through 1.0 opaque) anchorunknown animated[True | False] aspectunknown autoscale_onunknown autoscalex_onunknown autoscaley_onunknown axesan Axesinstanceaxes_locatorunknown axis_bgcolorany matplotlib color - see colors()axisbelow[ True | False ] clip_boxa matplotlib.transforms.Bboxinstanceclip_on[True | False] clip_path[ ( Path,Transform) |Patch| None ]color_cycleunknown containsa callable function figureunknown frame_on[ True | False ] gidan id string labelstring or anything printable with ‘%s’ conversion. navigate[ True | False ] navigate_modeunknown path_effectsunknown picker[None|float|boolean|callable] positionunknown rasterization_zorderunknown rasterized[True | False | None] sketch_paramsunknown snapunknown titleunknown transformTransforminstanceurla url string visible[True | False] xboundunknown xlabelunknown xlimlength 2 sequence of floats xmarginunknown xscale[‘linear’ | ‘log’ | ‘logit’ | ‘symlog’] xticklabelssequence of strings xtickssequence of floats yboundunknown ylabelunknown ylimlength 2 sequence of floats ymarginunknown yscale[‘linear’ | ‘log’ | ‘logit’ | ‘symlog’] yticklabelssequence of strings ytickssequence of floats zorderany number
-
add_axobserver(func) -
whenever the axes state change,
func(self)will be called
-
add_subplot(*args, **kwargs) -
Add a subplot. Examples:
fig.add_subplot(111)

# equivalent but more general
fig.add_subplot(1,1,1)

# add subplot with red background
fig.add_subplot(212, axisbg='r')

# add a polar subplot
fig.add_subplot(111, projection='polar')

# add Subplot instance sub
fig.add_subplot(sub)
kwargs are legal
Axeskwargs plus projection, which chooses a projection type for the axes. (For backward compatibility, polar=True may also be provided, which is equivalent to projection=’polar’). Valid values for projection are: [‘aitoff’, ‘hammer’, ‘lambert’, ‘mollweide’, ‘polar’, ‘rectilinear’]. Some of these projections support additional kwargs, which may be provided toadd_axes().The
Axesinstance will be returned.If the figure already has a subplot with key (args, kwargs) then it will simply make that subplot current and return it.
See also
subplot()for an explanation of the args.The following kwargs are supported:
Property Description adjustable[ ‘box’ | ‘datalim’ | ‘box-forced’] agg_filterunknown alphafloat (0.0 transparent through 1.0 opaque) anchorunknown animated[True | False] aspectunknown autoscale_onunknown autoscalex_onunknown autoscaley_onunknown axesan Axesinstanceaxes_locatorunknown axis_bgcolorany matplotlib color - see colors()axisbelow[ True | False ] clip_boxa matplotlib.transforms.Bboxinstanceclip_on[True | False] clip_path[ ( Path,Transform) |Patch| None ]color_cycleunknown containsa callable function figureunknown frame_on[ True | False ] gidan id string labelstring or anything printable with ‘%s’ conversion. navigate[ True | False ] navigate_modeunknown path_effectsunknown picker[None|float|boolean|callable] positionunknown rasterization_zorderunknown rasterized[True | False | None] sketch_paramsunknown snapunknown titleunknown transformTransforminstanceurla url string visible[True | False] xboundunknown xlabelunknown xlimlength 2 sequence of floats xmarginunknown xscale[‘linear’ | ‘log’ | ‘logit’ | ‘symlog’] xticklabelssequence of strings xtickssequence of floats yboundunknown ylabelunknown ylimlength 2 sequence of floats ymarginunknown yscale[‘linear’ | ‘log’ | ‘logit’ | ‘symlog’] yticklabelssequence of strings ytickssequence of floats zorderany number
-
autofmt_xdate(bottom=0.2, rotation=30, ha='right') -
Date ticklabels often overlap, so it is useful to rotate them and right align them. Also, a common use case is a number of subplots with shared xaxes where the x-axis is date data. The ticklabels are often long, and it helps to rotate them on the bottom subplot and turn them off on other subplots, as well as turn off xlabels.
- bottom
- The bottom of the subplots for
subplots_adjust() - rotation
- The rotation of the xtick labels
- ha
- The horizontal alignment of the xticklabels
-
axes -
Read-only: list of axes in Figure
-
clear() -
Clear the figure – synonym for
clf().
-
clf(keep_observers=False) -
Clear the figure.
Set keep_observers to True if, for example, a gui widget is tracking the axes in the figure.
-
colorbar(mappable, cax=None, ax=None, use_gridspec=True, **kw) -
Create a colorbar for a ScalarMappable instance, mappable.
Documentation for the pylab thin wrapper:
Add a colorbar to a plot.
Function signatures for the
pyplotinterface; all but the first are also method signatures for thecolorbar()method:colorbar(**kwargs) colorbar(mappable, **kwargs) colorbar(mappable, cax=cax, **kwargs) colorbar(mappable, ax=ax, **kwargs)
arguments:
- mappable
- the
Image,ContourSet, etc. to which the colorbar applies; this argument is mandatory for thecolorbar()method but optional for thecolorbar()function, which sets the default to the current image.
keyword arguments:
- cax
- None | axes object into which the colorbar will be drawn
- ax
- None | parent axes object(s) from which space for a new colorbar axes will be stolen. If a list of axes is given they will all be resized to make room for the colorbar axes.
- use_gridspec
- False | If cax is None, a new cax is created as an instance of Axes. If ax is an instance of Subplot and use_gridspec is True, cax is created as an instance of Subplot using the grid_spec module.
Additional keyword arguments are of two kinds:
axes properties:
Property Description orientation vertical or horizontal fraction 0.15; fraction of original axes to use for colorbar pad 0.05 if vertical, 0.15 if horizontal; fraction of original axes between colorbar and new image axes shrink 1.0; fraction by which to shrink the colorbar aspect 20; ratio of long to short dimensions anchor (0.0, 0.5) if vertical; (0.5, 1.0) if horizontal; the anchor point of the colorbar axes panchor (1.0, 0.5) if vertical; (0.5, 0.0) if horizontal; the anchor point of the colorbar parent axes. If False, the parent axes’ anchor will be unchanged colorbar properties:
Property Description extend [ ‘neither’ | ‘both’ | ‘min’ | ‘max’ ] If not ‘neither’, make pointed end(s) for out-of- range values. These are set for a given colormap using the colormap set_under and set_over methods. extendfrac [ None | ‘auto’ | length | lengths ] If set to None, both the minimum and maximum triangular colorbar extensions with have a length of 5% of the interior colorbar length (this is the default setting). If set to ‘auto’, makes the triangular colorbar extensions the same lengths as the interior boxes (when spacing is set to ‘uniform’) or the same lengths as the respective adjacent interior boxes (when spacing is set to ‘proportional’). If a scalar, indicates the length of both the minimum and maximum triangular colorbar extensions as a fraction of the interior colorbar length. A two-element sequence of fractions may also be given, indicating the lengths of the minimum and maximum colorbar extensions respectively as a fraction of the interior colorbar length. extendrect [ False | True ] If False the minimum and maximum colorbar extensions will be triangular (the default). If True the extensions will be rectangular. spacing [ ‘uniform’ | ‘proportional’ ] Uniform spacing gives each discrete color the same space; proportional makes the space proportional to the data interval. ticks [ None | list of ticks | Locator object ] If None, ticks are determined automatically from the input. format [ None | format string | Formatter object ] If None, the ScalarFormatteris used. If a format string is given, e.g., ‘%.3f’, that is used. An alternativeFormatterobject may be given instead.drawedges [ False | True ] If true, draw lines at color boundaries. The following will probably be useful only in the context of indexed colors (that is, when the mappable has norm=NoNorm()), or other unusual circumstances.
Property Description boundaries None or a sequence values None or a sequence which must be of length 1 less than the sequence of boundaries. For each region delimited by adjacent entries in boundaries, the color mapped to the corresponding value in values will be used. If mappable is a
ContourSet, its extend kwarg is included automatically.Note that the shrink kwarg provides a simple way to keep a vertical colorbar, for example, from being taller than the axes of the mappable to which the colorbar is attached; but it is a manual method requiring some trial and error. If the colorbar is too tall (or a horizontal colorbar is too wide) use a smaller value of shrink.
For more precise control, you can manually specify the positions of the axes objects in which the mappable and the colorbar are drawn. In this case, do not use any of the axes properties kwargs.
It is known that some vector graphics viewer (svg and pdf) renders white gaps between segments of the colorbar. This is due to bugs in the viewers not matplotlib. As a workaround the colorbar can be rendered with overlapping segments:
cbar = colorbar()
cbar.solids.set_edgecolor("face")
draw()
However this has negative consequences in other circumstances. Particularly with semi transparent images (alpha < 1) and colorbar extensions and is not enabled by default see (issue #1188).
- returns:
-
Colorbarinstance; see also its base class,ColorbarBase. Call theset_label()method to label the colorbar.
-
contains(mouseevent) -
Test whether the mouse event occurred on the figure.
Returns True,{}
-
delaxes(a) -
remove a from the figure and update the current axes
-
dpi
-
draw(artist, renderer, *args, **kwargs) -
Render the figure using
matplotlib.backend_bases.RendererBaseinstance renderer.
-
draw_artist(a) -
draw
matplotlib.artist.Artistinstance a only – this is available only after the figure is drawn
-
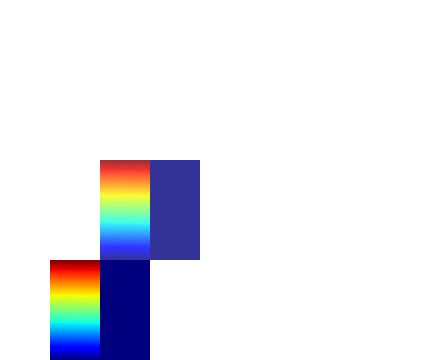
figimage(X, xo=0, yo=0, alpha=None, norm=None, cmap=None, vmin=None, vmax=None, origin=None, resize=False, **kwargs) -
Adds a non-resampled image to the figure.
call signatures:
figimage(X, **kwargs)
adds a non-resampled array X to the figure.
figimage(X, xo, yo)
with pixel offsets xo, yo,
X must be a float array:
- If X is MxN, assume luminance (grayscale)
- If X is MxNx3, assume RGB
- If X is MxNx4, assume RGBA
Optional keyword arguments:
Keyword Description resize a boolean, True or False. If “True”, then re-size the Figure to match the given image size. xo or yo An integer, the x and y image offset in pixels cmap a matplotlib.colors.Colormapinstance, e.g., cm.jet. If None, default to the rcimage.cmapvaluenorm a matplotlib.colors.Normalizeinstance. The default is normalization(). This scales luminance -> 0-1vmin|vmax are used to scale a luminance image to 0-1. If either is None, the min and max of the luminance values will be used. Note if you pass a norm instance, the settings for vmin and vmax will be ignored. alpha the alpha blending value, default is None origin [ ‘upper’ | ‘lower’ ] Indicates where the [0,0] index of the array is in the upper left or lower left corner of the axes. Defaults to the rc image.origin value figimage complements the axes image (
imshow()) which will be resampled to fit the current axes. If you want a resampled image to fill the entire figure, you can define anAxeswith size [0,1,0,1].An
matplotlib.image.FigureImageinstance is returned.(Source code, png, hires.png, pdf)
Additional kwargs are Artist kwargs passed on to
FigureImage
-
gca(**kwargs) -
Get the current axes, creating one if necessary
The following kwargs are supported for ensuring the returned axes adheres to the given projection etc., and for axes creation if the active axes does not exist:
Property Description adjustable[ ‘box’ | ‘datalim’ | ‘box-forced’] agg_filterunknown alphafloat (0.0 transparent through 1.0 opaque) anchorunknown animated[True | False] aspectunknown autoscale_onunknown autoscalex_onunknown autoscaley_onunknown axesan Axesinstanceaxes_locatorunknown axis_bgcolorany matplotlib color - see colors()axisbelow[ True | False ] clip_boxa matplotlib.transforms.Bboxinstanceclip_on[True | False] clip_path[ ( Path,Transform) |Patch| None ]color_cycleunknown containsa callable function figureunknown frame_on[ True | False ] gidan id string labelstring or anything printable with ‘%s’ conversion. navigate[ True | False ] navigate_modeunknown path_effectsunknown picker[None|float|boolean|callable] positionunknown rasterization_zorderunknown rasterized[True | False | None] sketch_paramsunknown snapunknown titleunknown transformTransforminstanceurla url string visible[True | False] xboundunknown xlabelunknown xlimlength 2 sequence of floats xmarginunknown xscale[‘linear’ | ‘log’ | ‘logit’ | ‘symlog’] xticklabelssequence of strings xtickssequence of floats yboundunknown ylabelunknown ylimlength 2 sequence of floats ymarginunknown yscale[‘linear’ | ‘log’ | ‘logit’ | ‘symlog’] yticklabelssequence of strings ytickssequence of floats zorderany number
-
get_axes()
-
get_children() -
get a list of artists contained in the figure
-
get_default_bbox_extra_artists()
-
get_dpi() -
Return the dpi as a float
-
get_edgecolor() -
Get the edge color of the Figure rectangle
-
get_facecolor() -
Get the face color of the Figure rectangle
-
get_figheight() -
Return the figheight as a float
-
get_figwidth() -
Return the figwidth as a float
-
get_frameon() -
get the boolean indicating frameon
-
get_size_inches() -
Returns the current size of the figure in inches (1in == 2.54cm) as an numpy array.
Returns: size : ndarray
The size of the figure in inches
See also
matplotlib.Figure.set_size_inches
-
get_tight_layout() -
Return the Boolean flag, True to use :meth`tight_layout` when drawing.
-
get_tightbbox(renderer) -
Return a (tight) bounding box of the figure in inches.
It only accounts axes title, axis labels, and axis ticklabels. Needs improvement.
-
get_window_extent(*args, **kwargs) -
get the figure bounding box in display space; kwargs are void
-
ginput(n=1, timeout=30, show_clicks=True, mouse_add=1, mouse_pop=3, mouse_stop=2) -
Call signature:
ginput(self, n=1, timeout=30, show_clicks=True,
       mouse_add=1, mouse_pop=3, mouse_stop=2)
Blocking call to interact with the figure.
This will wait for n clicks from the user and return a list of the coordinates of each click.
If timeout is zero or negative, does not timeout.
If n is zero or negative, accumulate clicks until a middle click (or potentially both mouse buttons at once) terminates the input.
Right clicking cancels last input.
The buttons used for the various actions (adding points, removing points, terminating the inputs) can be overriden via the arguments mouse_add, mouse_pop and mouse_stop, that give the associated mouse button: 1 for left, 2 for middle, 3 for right.
The keyboard can also be used to select points in case your mouse does not have one or more of the buttons. The delete and backspace keys act like right clicking (i.e., remove last point), the enter key terminates input and any other key (not already used by the window manager) selects a point.
-
hold(b=None) -
Set the hold state. If hold is None (default), toggle the hold state. Else set the hold state to boolean value b.
e.g.:
hold()      # toggle hold
hold(True)  # hold is on
hold(False) # hold is off
-
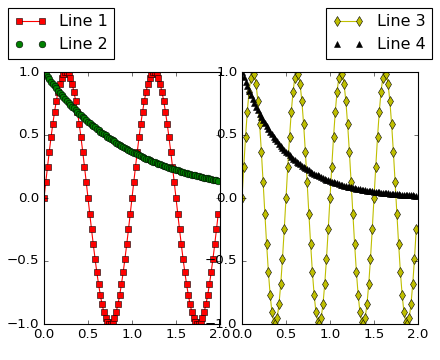
legend(handles, labels, *args, **kwargs) -
Place a legend in the figure. Labels are a sequence of strings, handles is a sequence of
Line2DorPatchinstances, and loc can be a string or an integer specifying the legend locationUSAGE:
legend( (line1, line2, line3),
        ('label1', 'label2', 'label3'),
        'upper right')
The loc location codes are:
'best' : 0,          (currently not supported for figure legends)
'upper right'  : 1,
'upper left'   : 2,
'lower left'   : 3,
'lower right'  : 4,
'right'        : 5,
'center left'  : 6,
'center right' : 7,
'lower center' : 8,
'upper center' : 9,
'center'       : 10,
loc can also be an (x,y) tuple in figure coords, which specifies the lower left of the legend box. figure coords are (0,0) is the left, bottom of the figure and 1,1 is the right, top.
Keyword arguments:
- prop: [ None | FontProperties | dict ]
- A
matplotlib.font_manager.FontPropertiesinstance. If prop is a dictionary, a new instance will be created with prop. If None, use rc settings. - numpoints: integer
- The number of points in the legend line, default is 4
- scatterpoints: integer
- The number of points in the legend line, default is 4
- scatteryoffsets: list of floats
- a list of yoffsets for scatter symbols in legend
- markerscale: [ None | scalar ]
- The relative size of legend markers vs. original. If None, use rc settings.
- markerfirst: [ True | False ]
- if True, legend marker is placed to the left of the legend label if False, legend marker is placed to the right of the legend label
- fancybox: [ None | False | True ]
- if True, draw a frame with a round fancybox. If None, use rc
- shadow: [ None | False | True ]
- If True, draw a shadow behind legend. If None, use rc settings.
- ncol : integer
- number of columns. default is 1
- mode : [ “expand” | None ]
- if mode is “expand”, the legend will be horizontally expanded to fill the axes area (or bbox_to_anchor)
- title : string
- the legend title
Padding and spacing between various elements use following keywords parameters. The dimensions of these values are given as a fraction of the fontsize. Values from rcParams will be used if None.
Keyword Description borderpad the fractional whitespace inside the legend border labelspacing the vertical space between the legend entries handlelength the length of the legend handles handletextpad the pad between the legend handle and text borderaxespad the pad between the axes and legend border columnspacing the spacing between columns Note
Not all kinds of artist are supported by the legend. See LINK (FIXME) for details.
Example:
(Source code, png, hires.png, pdf)
-
savefig(*args, **kwargs) -
Save the current figure.
Call signature:
savefig(fname, dpi=None, facecolor='w', edgecolor='w',
        orientation='portrait', papertype=None, format=None,
        transparent=False, bbox_inches=None, pad_inches=0.1,
        frameon=None)
The output formats available depend on the backend being used.
Arguments:
- fname:
-
A string containing a path to a filename, or a Python file-like object, or possibly some backend-dependent object such as
PdfPages.If format is None and fname is a string, the output format is deduced from the extension of the filename. If the filename has no extension, the value of the rc parameter
savefig.formatis used.If fname is not a string, remember to specify format to ensure that the correct backend is used.
Keyword arguments:
-
dpi: [ None | scalar > 0 | ‘figure’] - The resolution in dots per inch. If None it will default to the value
savefig.dpiin the matplotlibrc file. If ‘figure’ it will set the dpi to be the value of the figure. - facecolor, edgecolor:
- the colors of the figure rectangle
- orientation: [ ‘landscape’ | ‘portrait’ ]
- not supported on all backends; currently only on postscript output
- papertype:
- One of ‘letter’, ‘legal’, ‘executive’, ‘ledger’, ‘a0’ through ‘a10’, ‘b0’ through ‘b10’. Only supported for postscript output.
- format:
- One of the file extensions supported by the active backend. Most backends support png, pdf, ps, eps and svg.
- transparent:
- If True, the axes patches will all be transparent; the figure patch will also be transparent unless facecolor and/or edgecolor are specified via kwargs. This is useful, for example, for displaying a plot on top of a colored background on a web page. The transparency of these patches will be restored to their original values upon exit of this function.
- frameon:
- If True, the figure patch will be colored, if False, the figure background will be transparent. If not provided, the rcParam ‘savefig.frameon’ will be used.
- bbox_inches:
- Bbox in inches. Only the given portion of the figure is saved. If ‘tight’, try to figure out the tight bbox of the figure.
- pad_inches:
- Amount of padding around the figure when bbox_inches is ‘tight’.
- bbox_extra_artists:
- A list of extra artists that will be considered when the tight bbox is calculated.
-
sca(a) -
Set the current axes to be a and return a
-
set_canvas(canvas) -
Set the canvas that contains the figure
ACCEPTS: a FigureCanvas instance
-
set_dpi(val) -
Set the dots-per-inch of the figure
ACCEPTS: float
-
set_edgecolor(color) -
Set the edge color of the Figure rectangle
ACCEPTS: any matplotlib color - see help(colors)
-
set_facecolor(color) -
Set the face color of the Figure rectangle
ACCEPTS: any matplotlib color - see help(colors)
-
set_figheight(val, forward=False) -
Set the height of the figure in inches
ACCEPTS: float
-
set_figwidth(val, forward=False) -
Set the width of the figure in inches
ACCEPTS: float
-
set_frameon(b) -
Set whether the figure frame (background) is displayed or invisible
ACCEPTS: boolean
-
set_size_inches(w, h, forward=False) -
Set the figure size in inches (1in == 2.54cm)
Usage:
fig.set_size_inches(w,h)  # OR
fig.set_size_inches((w,h) )
optional kwarg forward=True will cause the canvas size to be automatically updated; e.g., you can resize the figure window from the shell
ACCEPTS: a w,h tuple with w,h in inches
See also
matplotlib.Figure.get_size_inches
-
set_tight_layout(tight) -
Set whether
tight_layout()is used upon drawing. If None, the rcParams[‘figure.autolayout’] value will be set.When providing a dict containing the keys
pad,w_pad,h_padandrect, the defaulttight_layout()paddings will be overridden.ACCEPTS: [True | False | dict | None ]
-
show(warn=True) -
If using a GUI backend with pyplot, display the figure window.
If the figure was not created using
figure(), it will lack aFigureManagerBase, and will raise an AttributeError.For non-GUI backends, this does nothing, in which case a warning will be issued if warn is True (default).
-
subplots_adjust(*args, **kwargs) -
Call signature:
subplots_adjust(left=None, bottom=None, right=None, top=None,
                    wspace=None, hspace=None)
Update the
SubplotParamswith kwargs (defaulting to rc when None) and update the subplot locations
-
suptitle(t, **kwargs) -
Add a centered title to the figure.
kwargs are
matplotlib.text.Textproperties. Using figure coordinates, the defaults are:- x : 0.5
- The x location of the text in figure coords
- y : 0.98
- The y location of the text in figure coords
- horizontalalignment : ‘center’
- The horizontal alignment of the text
- verticalalignment : ‘top’
- The vertical alignment of the text
A
matplotlib.text.Textinstance is returned.Example:
fig.suptitle('this is the figure title', fontsize=12)
-
text(x, y, s, *args, **kwargs) -
Add text to figure.
Call signature:
text(x, y, s, fontdict=None, **kwargs)
Add text to figure at location x, y (relative 0-1 coords). See
text()for the meaning of the other arguments.kwargs control the
Textproperties:Property Description agg_filterunknown alphafloat (0.0 transparent through 1.0 opaque) animated[True | False] axesan Axesinstancebackgroundcolorany matplotlib color bboxFancyBboxPatch prop dict clip_boxa matplotlib.transforms.Bboxinstanceclip_on[True | False] clip_path[ ( Path,Transform) |Patch| None ]colorany matplotlib color containsa callable function familyor fontname or fontfamily or name[FONTNAME | ‘serif’ | ‘sans-serif’ | ‘cursive’ | ‘fantasy’ | ‘monospace’ ] figurea matplotlib.figure.Figureinstancefontpropertiesor font_propertiesa matplotlib.font_manager.FontPropertiesinstancegidan id string horizontalalignmentor ha[ ‘center’ | ‘right’ | ‘left’ ] labelstring or anything printable with ‘%s’ conversion. linespacingfloat (multiple of font size) multialignment[‘left’ | ‘right’ | ‘center’ ] path_effectsunknown picker[None|float|boolean|callable] position(x,y) rasterized[True | False | None] rotation[ angle in degrees | ‘vertical’ | ‘horizontal’ ] rotation_modeunknown sizeor fontsize[size in points | ‘xx-small’ | ‘x-small’ | ‘small’ | ‘medium’ | ‘large’ | ‘x-large’ | ‘xx-large’ ] sketch_paramsunknown snapunknown stretchor fontstretch[a numeric value in range 0-1000 | ‘ultra-condensed’ | ‘extra-condensed’ | ‘condensed’ | ‘semi-condensed’ | ‘normal’ | ‘semi-expanded’ | ‘expanded’ | ‘extra-expanded’ | ‘ultra-expanded’ ] styleor fontstyle[ ‘normal’ | ‘italic’ | ‘oblique’] textstring or anything printable with ‘%s’ conversion. transformTransforminstanceurla url string usetexunknown variantor fontvariant[ ‘normal’ | ‘small-caps’ ] verticalalignmentor ma or va[ ‘center’ | ‘top’ | ‘bottom’ | ‘baseline’ ] visible[True | False] weightor fontweight[a numeric value in range 0-1000 | ‘ultralight’ | ‘light’ | ‘normal’ | ‘regular’ | ‘book’ | ‘medium’ | ‘roman’ | ‘semibold’ | ‘demibold’ | ‘demi’ | ‘bold’ | ‘heavy’ | ‘extra bold’ | ‘black’ ] wrapunknown xfloat yfloat zorderany number
-
tight_layout(renderer=None, pad=1.08, h_pad=None, w_pad=None, rect=None) -
Adjust subplot parameters to give specified padding.
Parameters:
- pad : float
- padding between the figure edge and the edges of subplots, as a fraction of the font-size.
- h_pad, w_pad : float
- padding (height/width) between edges of adjacent subplots. Defaults to
pad_inches. - rect : if rect is given, it is interpreted as a rectangle
- (left, bottom, right, top) in the normalized figure coordinate that the whole subplots area (including labels) will fit into. Default is (0, 0, 1, 1).
-
Call signature:
waitforbuttonpress(self, timeout=-1)
Blocking call to interact with the figure.
This will return True is a key was pressed, False if a mouse button was pressed and None if timeout was reached without either being pressed.
If timeout is negative, does not timeout.
-
class matplotlib.figure.SubplotParams(left=None, bottom=None, right=None, top=None, wspace=None, hspace=None) -
Bases:
objectA class to hold the parameters for a subplot
All dimensions are fraction of the figure width or height. All values default to their rc params
The following attributes are available
- left : 0.125
- The left side of the subplots of the figure
- right : 0.9
- The right side of the subplots of the figure
- bottom : 0.1
- The bottom of the subplots of the figure
- top : 0.9
- The top of the subplots of the figure
- wspace : 0.2
- The amount of width reserved for blank space between subplots
- hspace : 0.2
- The amount of height reserved for white space between subplots
-
update(left=None, bottom=None, right=None, top=None, wspace=None, hspace=None) -
Update the current values. If any kwarg is None, default to the current value, if set, otherwise to rc
-
matplotlib.figure.figaspect(arg) -
Create a figure with specified aspect ratio. If arg is a number, use that aspect ratio. If arg is an array, figaspect will determine the width and height for a figure that would fit array preserving aspect ratio. The figure width, height in inches are returned. Be sure to create an axes with equal with and height, e.g.,
Example usage:
# make a figure twice as tall as it is wide
w, h = figaspect(2.)
fig = Figure(figsize=(w,h))
ax = fig.add_axes([0.1, 0.1, 0.8, 0.8])
ax.imshow(A, **kwargs)

# make a figure with the proper aspect for an array
A = rand(5,3)
w, h = figaspect(A)
fig = Figure(figsize=(w,h))
ax = fig.add_axes([0.1, 0.1, 0.8, 0.8])
ax.imshow(A, **kwargs)
Thanks to Fernando Perez for this function
© 2012–2016 Matplotlib Development Team. All rights reserved.
Licensed under the Matplotlib License Agreement.
http://matplotlib.org/1.5.3/api/figure_api.html