W3cubDocs
/scikit-learnIncremental PCA
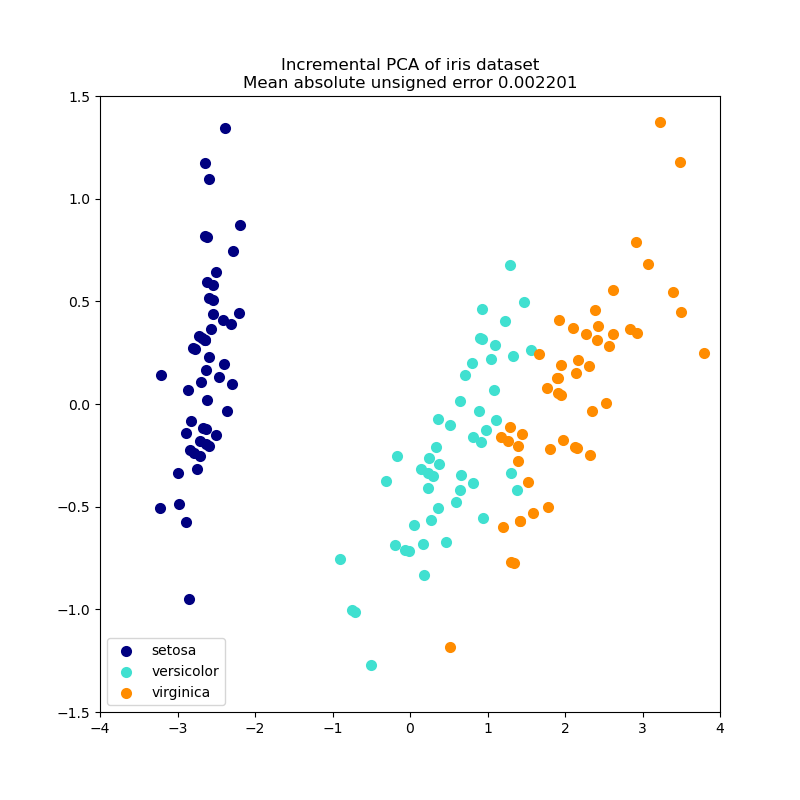
Incremental principal component analysis (IPCA) is typically used as a replacement for principal component analysis (PCA) when the dataset to be decomposed is too large to fit in memory. IPCA builds a low-rank approximation for the input data using an amount of memory which is independent of the number of input data samples. It is still dependent on the input data features, but changing the batch size allows for control of memory usage.
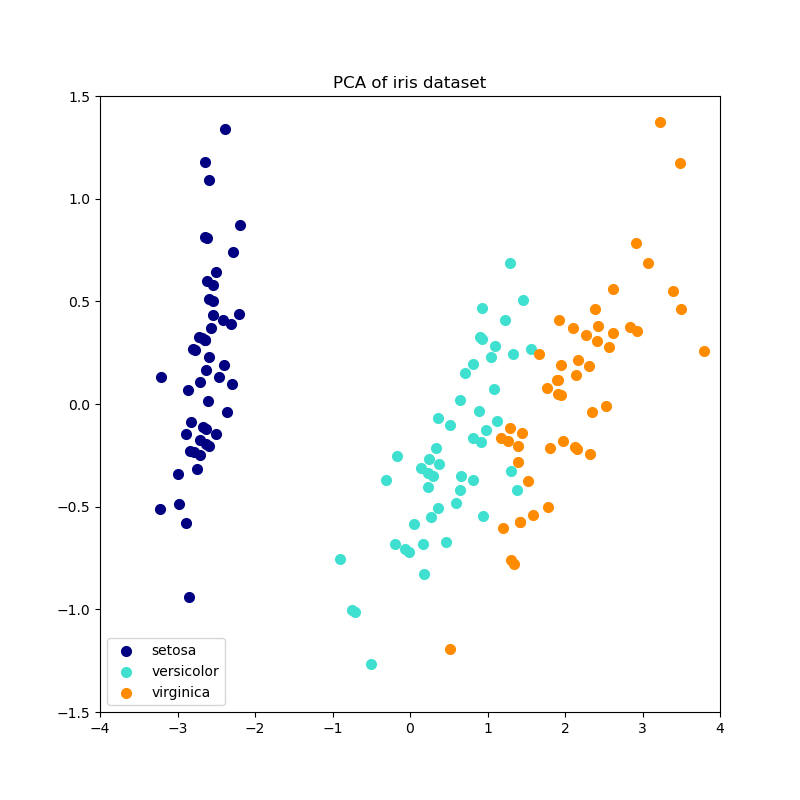
This example serves as a visual check that IPCA is able to find a similar projection of the data to PCA (to a sign flip), while only processing a few samples at a time. This can be considered a “toy example”, as IPCA is intended for large datasets which do not fit in main memory, requiring incremental approaches.
print(__doc__)

# Authors: Kyle Kastner
# License: BSD 3 clause

import numpy as np
import matplotlib.pyplot as plt

from sklearn.datasets import load_iris
from sklearn.decomposition import PCA, IncrementalPCA

iris = load_iris()
X = iris.data
y = iris.target

n_components = 2
ipca = IncrementalPCA(n_components=n_components, batch_size=10)
X_ipca = ipca.fit_transform(X)

pca = PCA(n_components=n_components)
X_pca = pca.fit_transform(X)

colors = ['navy', 'turquoise', 'darkorange']

for X_transformed, title in [(X_ipca, "Incremental PCA"), (X_pca, "PCA")]:
    plt.figure(figsize=(8, 8))
    for color, i, target_name in zip(colors, [0, 1, 2], iris.target_names):
        plt.scatter(X_transformed[y == i, 0], X_transformed[y == i, 1],
                    color=color, lw=2, label=target_name)

    if "Incremental" in title:
        err = np.abs(np.abs(X_pca) - np.abs(X_ipca)).mean()
        plt.title(title + " of iris dataset\nMean absolute unsigned error "
                  "%.6f" % err)
    else:
        plt.title(title + " of iris dataset")
    plt.legend(loc="best", shadow=False, scatterpoints=1)
    plt.axis([-4, 4, -1.5, 1.5])

plt.show()
Total running time of the script: (0 minutes 0.188 seconds)
plot_incremental_pca.py
plot_incremental_pca.ipynb
© 2007–2016 The scikit-learn developers
Licensed under the 3-clause BSD License.
http://scikit-learn.org/stable/auto_examples/decomposition/plot_incremental_pca.html

