W3cubDocs
/NumPy 1.10numpy.random.random_integers
numpy.random.random_integers(low, high=None, size=None)-
Return random integers between
lowandhigh, inclusive.Return random integers from the “discrete uniform” distribution in the closed interval [
low,high]. Ifhighis None (the default), then results are from [1,low].Parameters: low : int
Lowest (signed) integer to be drawn from the distribution (unless
high=None, in which case this parameter is the highest such integer).high : int, optional
If provided, the largest (signed) integer to be drawn from the distribution (see above for behavior if
high=None).size : int or tuple of ints, optional
Output shape. If the given shape is, e.g.,
(m, n, k), thenm * n * ksamples are drawn. Default is None, in which case a single value is returned.Returns: out : int or ndarray of ints
size-shaped array of random integers from the appropriate distribution, or a single such random int ifsizenot provided.See also
random.randint- Similar to
random_integers, only for the half-open interval [low,high), and 0 is the lowest value ifhighis omitted.
Notes
To sample from N evenly spaced floating-point numbers between a and b, use:
a + (b - a) * (np.random.random_integers(N) - 1) / (N - 1.)
Examples
>>> np.random.random_integers(5)
4
>>> type(np.random.random_integers(5))
<type 'int'>
>>> np.random.random_integers(5, size=(3.,2.))
array([[5, 4],
       [3, 3],
       [4, 5]])
Choose five random numbers from the set of five evenly-spaced numbers between 0 and 2.5, inclusive (i.e., from the set
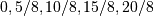 ):
):>>> 2.5 * (np.random.random_integers(5, size=(5,)) - 1) / 4. array([ 0.625, 1.25 , 0.625, 0.625, 2.5 ])
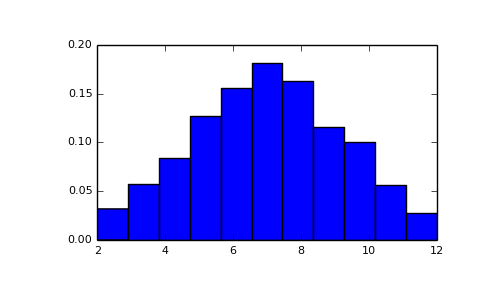
Roll two six sided dice 1000 times and sum the results:
>>> d1 = np.random.random_integers(1, 6, 1000)
>>> d2 = np.random.random_integers(1, 6, 1000)
>>> dsums = d1 + d2
Display results as a histogram:
>>> import matplotlib.pyplot as plt
>>> count, bins, ignored = plt.hist(dsums, 11, normed=True)
>>> plt.show()
(Source code, png, pdf)
© 2008–2016 NumPy Developers
Licensed under the NumPy License.
https://docs.scipy.org/doc/numpy-1.10.1/reference/generated/numpy.random.random_integers.html